
A manufacturer’s emissions can keep running for years after a product is sold. If I make boilers, cars, air conditioners or washing machines, I may need to count the emissions from how those products are used over their full life - and book that total in the year I sold them.
Here’s the short version:
- Scope 3 Category 11 covers emissions from the first use of sold products
- It often makes up more than 50% of total emissions for product makers in sectors like vehicles, appliances and equipment
- The basic maths is simple: units sold × lifetime energy or fuel use × emission factor
- The hard part is getting the boundary, assumptions and regional data right
- For buyers and investors, this can change how they view risk, product mix, capex and R&D plans
- In the UK, Scope 3 reporting under SRS S2 is due from 1 January 2028 on a comply-or-explain basis for in-scope companies
A few points matter most. I would count direct use emissions for products that burn fuel, use electricity or leak refrigerants. I would keep out things that belong in other categories, like downstream transport or end-of-life treatment. And if products are used in different ways across markets, I would not use one blanket average.
So the core question is simple: what emissions does a product cause after sale, and how sure am I about the estimate? That is the number this article explains.
The problem: what Scope 3 Category 11 covers and where teams go wrong
Category 11 puts a sold product’s lifetime emissions into the year of sale [1]. That sounds simple, but teams often trip over the boundary.
Here’s the core rule: count only the first use after sale. Don’t include resale or second-hand use [1]. So if a product changes hands later, those later emissions don’t stay in Category 11 for the first seller.
There’s another point that gets missed. Some products don’t use energy directly when people use them. Furniture is a good example. In cases like that, Category 11 applies only through indirect use-phase emissions. For investors, this is the downstream footprint that can affect value and transition risk. For diligence, it sets the line for what downstream emissions need to be checked.
Direct vs indirect use-phase emissions
The GHG Protocol splits Category 11 into direct and indirect use-phase emissions.
Direct use-phase emissions are required for products that:
- burn fuel
- use electricity
- leak refrigerants in use [2]
Indirect use-phase emissions are optional, but they should be included when they matter in a material way [2].
A few examples make the split easier to see. Direct emissions include combustion engines, gas boilers, and air-conditioning units. Indirect emissions include clothing that the user washes and dries, or cookware used on an energy-consuming hob [2].
Sectors where use-phase emissions usually dominate
Category 11 often makes up the largest share in appliances, vehicles, and industrial equipment. Why? Because emissions from use over a product’s life can be far higher than emissions from making it in the first place.
That means the total can climb fast as unit sales grow [1]. Sell more units, and the use-phase footprint can expand at the same pace.
Common boundary errors in reporting
The most common reporting error is mixing Category 11 with other Scope 3 categories. That’s where figures start to drift.
Keep the lines clear:
- Downstream transport to the end customer sits in Category 9
- Further processing of intermediate products sits in Category 10
- Disposal, decommissioning, and recycling sit in Category 12 [4]
When teams bundle those categories together, the Category 11 figure gets distorted. And if the boundary is wrong, deal decisions can go wrong too.
There’s one more trap. If user behaviour differs a lot across markets or customer groups, don’t rely on one global average. Segment by use profile instead [1]. Once that boundary is set properly, the next job is to calculate use-phase emissions per unit.
sbb-itb-6ca8558
The solution: how to calculate use-phase emissions
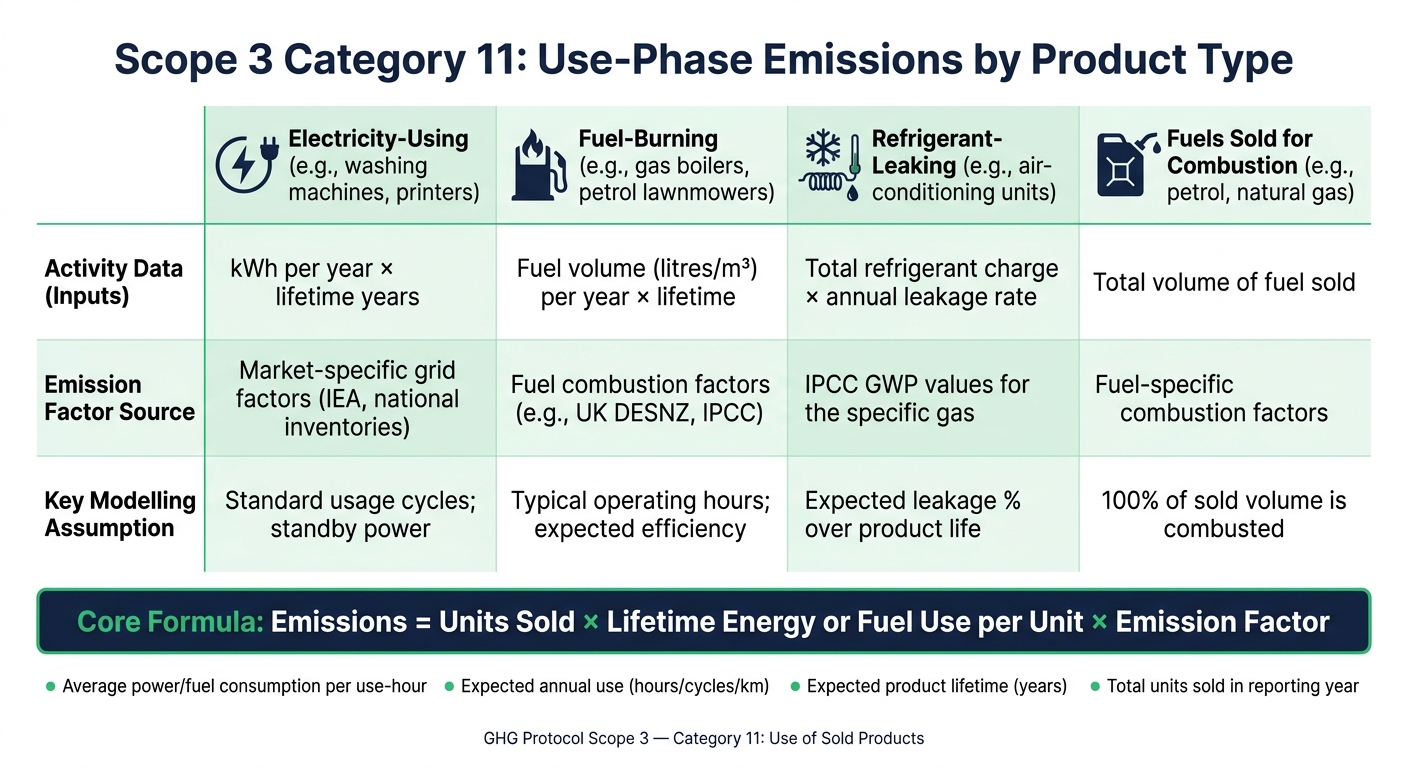
Scope 3 Category 11: Use-Phase Emissions by Product Type
Once the boundary is set, use-phase emissions can be calculated with a simple equation:
Emissions = Units sold × Lifetime energy or fuel use per unit × Emission factor [1]
Lifetime energy use comes from average annual consumption multiplied by the product’s expected lifespan in years. For products that run on electricity, you then multiply that total by a grid emission factor. For products that burn fuel, you use a fuel combustion factor instead.
Core formula by product type
The logic stays the same across product types. What changes is the activity data and the source of the emission factor, based on how the product creates emissions. The table below shows how this works in the sectors where Category 11 most often dominates: appliances, vehicles and industrial equipment.
| Product Type | Activity Data (Inputs) | Emission Factor Source | Modelling Assumption |
|---|---|---|---|
| Electricity-using (e.g., washing machines, printers) | kWh per year × lifetime years | Market-specific grid factors for each sales region | Standard usage cycles; standby power |
| Fuel-burning (e.g., gas boilers, petrol lawnmowers) | Fuel volume (litres/m³) per year × lifetime | Fuel combustion factors (e.g., UK DESNZ, IPCC) | Typical operating hours; Expected efficiency |
| Refrigerant-leaking (e.g., air-conditioning units, fire extinguishers) | Total refrigerant charge × annual leakage rate | IPCC GWP values for the specific gas | Expected leakage % over product life |
| Fuels sold for combustion (e.g., petrol, natural gas) | Total volume of fuel sold | Fuel-specific combustion factors | 100% of sold volume is combusted |
For electricity-using products, use market-specific grid factors for each sales region instead of one global average [1].
Breaking down lifetime energy and fuel use into practical inputs
In practice, the calculation usually relies on four inputs:
- Average power or fuel consumption per use-hour, cycle or kilometre
- Expected annual use in hours, cycles or kilometres
- Expected product lifetime in years
- Total units sold in the reporting year
If internal product data isn’t available, you can fall back on an average-use model and industry benchmarks [1][2].
There’s one wrinkle worth flagging. Products with a longer lifespan can look worse on a total emissions basis simply because they stay in use for more years. That matters when investors compare assets side by side. To keep the picture clear, pair total emissions with intensity metrics, such as emissions per hour of use or per kilometre, so the result is read in the right way [2].
The next step is choosing the right activity data and emission factors.
Data inputs, assumptions and evidence quality
Once the boundary and formula are set, the next step is simple: can you trust the inputs? A Category 11 estimate is only as strong as the data behind it. For diligence and reporting, Category 11 usually depends on three core inputs: sales, product use and emission factors [1].
Preferred inputs and fallback estimates
The best inputs tend to come from inside the business. Sales volumes from ERP or CRM systems, energy-use figures from R&D testing, product lifespans from warranty records, and market-specific grid factors from IEA or national inventory datasets generally sit highest in the evidence stack [1].
| Data Element | Preferred Source | Fallback Source |
|---|---|---|
| Units sold | Internal ERP or CRM systems | Market share estimates |
| Lifetime energy use | R&D testing, energy labels | IEA datasets, industry averages |
| Product lifespan | Warranty data, durability testing | Typical market replacement cycles |
| Emission factors | Market-specific grid factors (IEA, national inventories) | Regional grid averages |
Fallback estimates still have a place. But they need to be treated for what they are: stand-ins, not direct proof. If a business swaps measured inputs for averages or proxies, that should be obvious in the model and in the write-up.
Measured data vs engineering estimates vs scenario assumptions
Not all inputs deserve the same level of confidence. And if you mix them together without clear labels, the model can look stronger than it is. That tends to become a problem later, especially when someone digs into the detail.
The GHG Protocol recommends documenting data quality across five dimensions: technological, geographical and temporal representativeness, completeness, and reliability [5].
| Data Source | Typical Use Case | Evidence strength |
|---|---|---|
| Observed data | Direct customer usage data or detailed market research | High - reflects actual behaviour |
| Design-based estimates | Product design specifications and internal R&D testing | Medium-high - based on controlled testing |
| Energy labels / LCAs | High-volume goods such as washing machines | Medium - standardised benchmarks |
| Scenario assumptions | New market entries or products with no history | Low-medium - based on proxies |
A clean split between observed data and modelled assumptions makes review much easier. It shows where confidence is high, where judgement calls were made, and where the estimate may shift if better data comes in.
Multiple use scenarios and regional electricity factors
When product use changes by market or customer type, the model should reflect that. Segment by usage intensity, then apply regional electricity factors. That helps avoid overstating or understating Category 11 when user behaviour differs a lot across markets or customer groups [1].
For example, the same product may be used far more often in one country than another, or by commercial users far more than household users. If the model uses one average for everyone, the output can drift away from what is happening on the ground.
That evidence quality shapes how much weight investors can place on the result in diligence.
What the result means for makers, investors and decarbonisation plans
Category 11 shows, very plainly, how product design and market mix shape emissions. It does more than put a number on the problem. It shows where day-to-day business choices change the outcome.
For products that use energy, the biggest lever is often product design and use-phase efficiency. That matters because it points teams towards the part of the business most likely to change results. If lifetime energy use is doing most of the work in the calculation, the priority is eco-design and engineering efficiency. If the emission factor is doing more of the work, sales mix matters too. In that case, moving sales towards markets with lower-carbon grids can cut reported emissions for the same product [3].
How Category 11 findings shape diligence and value-creation priorities
For diligence teams, this number is a practical test of transition risk and roadmap quality. A portfolio tilted towards fuel combustion or heavy electricity use faces pressure from tighter energy-efficiency rules, carbon pricing, and changing buyer demand. The key check is simple: do R&D plans and capex line up with the decarbonisation path [1] [4]?
Intensity metrics matter just as much as totals. An automaker can post a higher absolute Category 11 figure simply because it sold more vehicles, even while emissions per kilometre fall. That is why investors should ask for both:
- Absolute lifetime emissions
- An intensity metric, such as kg CO₂e per km or per functional unit
That split helps separate real efficiency gains from plain volume growth [2].
The pressure is building. Under UK SRS S2, Scope 3 reporting, including Category 11, becomes comply-or-explain for in-scope companies from 1 January 2028 [4]. For product makers, that leaves a short runway to put sound methods in place before disclosure shifts from optional to mandatory.
Conclusion: the key points to take away
In practice, Category 11 is only useful when the boundary, inputs and use case are clear. It is only defensible when the boundary is clear, inputs are documented, and use-phase estimates are based on measured data [1] [2] [3].