
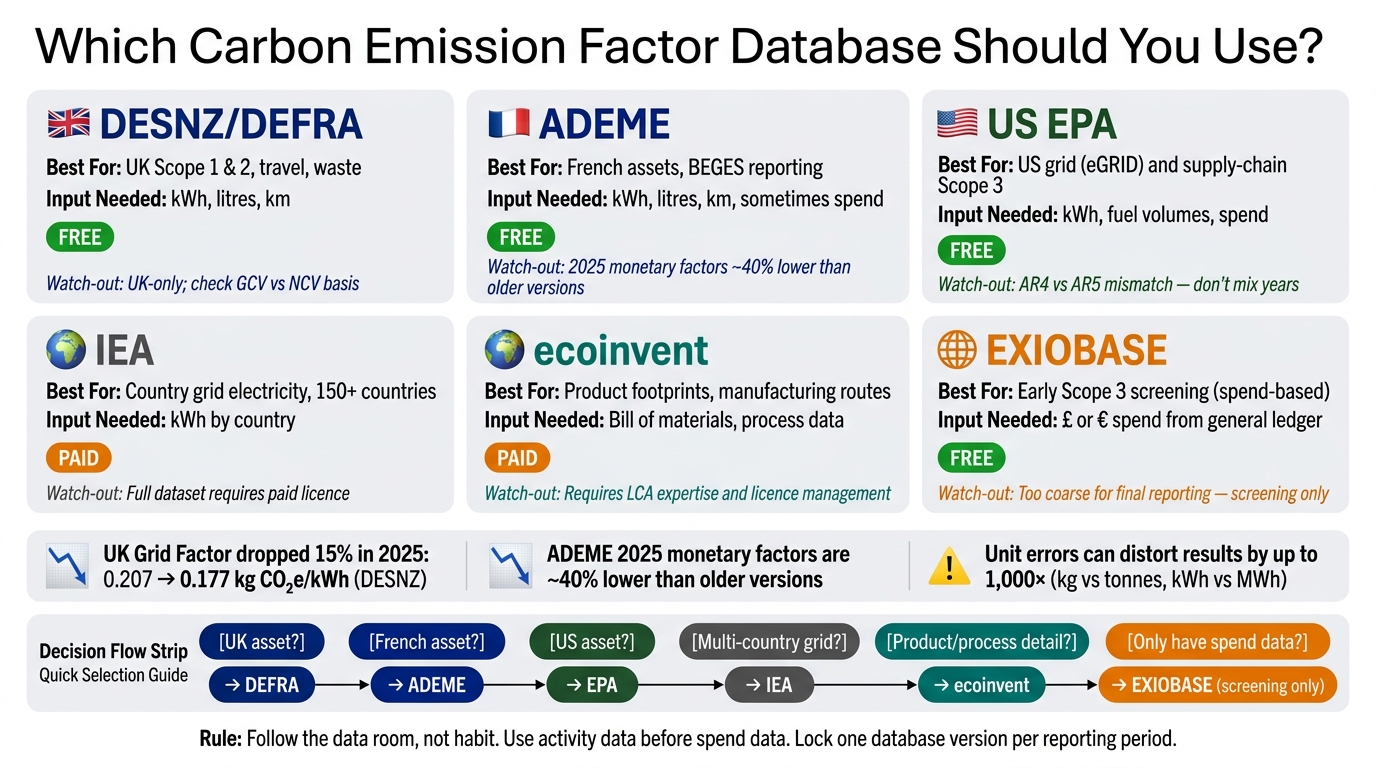
If I need a fast answer: I match the database to the asset’s country, the data I have, and the level of detail I need. For UK activity data, I start with DESNZ/DEFRA. For France, ADEME. For US assets, EPA. For country electricity factors, IEA. For product or process detail, ecoinvent. And if I only have spend data, I use EXIOBASE as a first-pass estimate.
That choice can shift results more than people expect. For example, the 2025 DESNZ grid factor fell by about 15% versus 2024, from 0.207 to 0.177 kg CO₂e/kWh. And ADEME’s 2025 monetary factors are about 40% lower than older values. So if I pick the wrong source or mix years, the output can move a lot.
Here’s the short version:
- DESNZ/DEFRA: best for UK fuel, electricity, travel and waste data
- ADEME: best for French assets, including BEGES-style work
- EPA: best for US grid and US supply-chain estimates
- IEA: best for multi-country electricity factors
- ecoinvent: best for product footprints and manufacturing routes
- EXIOBASE: best when I only have general ledger or spend data
What matters most is simple:
- Use national sources first where possible
- Use activity data before spend data
- Keep one version and one GWP basis across the study
- Check units carefully: kg vs tonnes, kWh vs MWh, passenger-km vs vehicle-km
- Avoid broad rows when a more specific factor exists
Carbon Factor Database Comparison: DEFRA vs ADEME vs ecoinvent vs EPA vs IEA vs EXIOBASE
Quick Comparison
| Database | Best used for | Input needed | Main watch-out |
|---|---|---|---|
| DESNZ/DEFRA | UK Scope 1 and 2, travel, waste | kWh, litres, km | UK-only; check GCV vs NCV |
| ADEME | French assets and reporting | kWh, litres, km, sometimes spend | Version changes can shift results |
| EPA | US assets | kWh, fuel, spend | AR4 vs AR5 year mismatch |
| IEA | Country grid electricity | kWh by country | Paid access for full data |
| ecoinvent | Product and process analysis | Bill of materials, process data | Licence cost and model choice |
| EXIOBASE | Early Scope 3 screening | £ or € spend | Too coarse for final numbers |
So my rule is simple: follow the data room, not habit. If the file has meter reads and fuel volumes, I use activity factors. If it has process inputs, I use ecoinvent. If it only has spend, I use EXIOBASE and label it as screening only.
sbb-itb-6ca8558
How the main databases compare
These six sources do different jobs. The right choice depends on geography, the kind of data you have, and whether you need a rough screening view or numbers fit for reporting. So the question isn't which database wins overall. It's which one fits the data room.
DESNZ/DEFRA and ADEME: UK and French activity data
DESNZ/DEFRA is the default choice for UK activity-based reporting. It's public, free, and aligned to SECR and UK SRS S2.
France follows a similar pattern, but the reporting rules and factor library aren't the same.
ADEME Base Empreinte is France's national reference. It now brings together the former Base Carbone, Base IMPACTS and Agribalyse datasets. One point matters a lot here: ADEME's 2025 monetary factors are about 40% lower than earlier versions. If you're using an older spend-based model, it can overstate French assets.
EPA and IEA: US operations and country grid factors

EPA splits the job in two. eGRID covers US grid factors, while Supply Chain factors support spend-based Scope 3 analysis. EPA's 2023 factors use AR4; 2024 and 2025 use AR5, so don't mix years unless you re-base first [3].
US grid factors and global grid factors sound close, but they answer different needs.
IEA is the country-grid reference for multi-country portfolios and scenario work. Full dataset access is paid.
ecoinvent and EXIOBASE: product-level and spend-based analysis
ecoinvent fits product-level and manufacturing due diligence. But there is a catch: it needs a commercial licence and LCA expertise.
EXIOBASE fits early-stage Scope 3 screening when spend data is all you have. That's useful at the start, but it's still a screening tool. It's too coarse for final reporting.
Use the table below as a selection filter, not a league table.
| Database | Geographic Focus | Method Type | Licence Model | Update Pattern | Main Limitations |
|---|---|---|---|---|---|
| DESNZ/DEFRA | United Kingdom | Activity-based / combustion | Public / free | Annual | UK-specific; limited global applicability |
| ADEME | France | LCA-based (ISO 14040/44) | Public / free | Ongoing | French-specific; check version and validity status |
| US EPA | United States | Grid and supply-chain factors | Public / free | Annual | Limited to US grid and broad sectors |
| IEA | International | Energy statistics | Licensed / paid | Annual | Full dataset access requires paid licence |
| ecoinvent | Global | Granular LCI | Licensed / paid | Periodic | Requires LCA expertise and licence management |
| EXIOBASE | Multi-regional | EEIO (spend-based) | Publicly available | Periodic | Screening only; lacks precision for final reporting |
Choosing a database by deal situation
The comparison table above shows what each database is for. This section is about something more practical: which one to use first based on what is in the data room.
A working order of priority for private equity teams
Use the table above as your shortlist. Then use the deal situation to settle any close calls.
In most cases, the answer becomes obvious once you start with the data room. Begin with the national database for the country where the target operates. If the target is UK-based, DESNZ/DEFRA is the default starting point. If the asset is French, ADEME Base Empreinte is the reference source. Just check the version first, because ADEME’s 2025 monetary factors are about 40% lower than earlier values [4].
For multi-country electricity factors, use IEA. If emissions are driven by specific manufactured inputs, ecoinvent gives you process-level detail. If spend data is the only input you can trust, EXIOBASE works as a screening tool of last resort.
That’s why factor choice should follow the data, not the other way round.
The table below shows how that order shifts by deal type.
Database selection for services, manufacturing and early screening
When the business model is the main variable, these are the default starting points.
The matrix below turns source choice into a simple first-pass rule set.
| Deal Situation | Primary Database | Refinement Layer | Notes |
|---|---|---|---|
| UK services (utilities, travel, waste) | DESNZ/DEFRA | IEA for Scope 2 if any non-UK sites | Verify Gross Calorific Value basis for gas [2] |
| French asset with agri-food or construction exposure | ADEME Base Empreinte | - | Use "Valide générique" factors; verify the 2025 version [4] |
| Global manufacturer with bill of materials complexity | ecoinvent | IEA for electricity by country | Stick to one system model throughout [7] |
| Pre-LOI screening with only general ledger data | EXIOBASE | ADEME monetary ratios for French spend | Flag as screening-only in the output [5] |
Common library traps that distort results
Picking the right database is only half the battle. You also need to use the library properly. Even a good database can lead you off course if you pull the wrong row, mix units, lose decimal precision, or combine versions that don't belong together.
The tricky part is that the output can still look fine. That's why these mistakes slip through. The main trouble spots are row selection, units, precision, and version control.
Broad rows versus specific rows
In ecoinvent, selecting a generic "market for" entry instead of a specific activity can water down the hotspot signal and hide differences between technologies [1]. You see the same problem in DEFRA and ADEME when someone stops at a broad sector category and never digs deeper.
The fix is simple: use the most specific row that fits the activity. Broad categories smooth everything out, and that can hide what actually matters.
Rounding to zero and unit mismatches
Small factors can vanish if they are stored with too few decimal places. Once they round to zero, small but frequent activities drop out of the footprint altogether.
Unit errors are even nastier because they can blow results up by 1,000× in either direction. Common examples include:
- kg versus tonnes
- kWh versus MWh
- passenger-km versus vehicle-km
Also check the gas basis. GCV and NCV are not interchangeable [2]. A quick sense-check on the size of every line item can save a lot of pain before those errors snowball.
Version drift across years and sources
Using the 2025 factor for 2023 activity data can understate past emissions [2]. That risk is not small. In the 2025 DESNZ release, the UK grid-average factor fell by about 15% compared with 2024, moving from 0.207 to 0.177 kg CO₂e/kWh [8].
Mixing versions creates a different kind of problem. If one part of a study uses one background database version and another part uses a later one, your comparisons stop being clean. Lock one database version for the full reporting period so the background data stays aligned [1].
These issues are easy to miss, so it's smart to treat them as a pre-calculation check rather than a last-minute fix. The table below shows the main traps and the control for each.
| Trap | How It Appears | Likely Distortion | Control |
|---|---|---|---|
| Broad rows | Generic "Steel" used instead of "Steel, electric arc furnace" | Dilutes the hotspot signal; hides key technology differences | Always search for the most specific row first |
| Rounding to zero | Sub-unit factors stored with too few decimal places | Small, high-volume activities disappear from the footprint | Ensure factor libraries store sufficient decimal precision |
| Unit mismatch | Factor in kg applied to data in tonnes, or kWh vs. MWh | 1,000× over- or under-statement | Normalise all units before calculation |
| Version drift | Mixing ecoinvent v3.8 and v3.12 in one study [1] | Inconsistent background data distorts comparisons | Lock a single database version for the reporting period [1] |
Conclusion: match the source to the decision
The choice comes down to three things: where the asset operates, what data the deal team has, and how exact the output needs to be.
For most teams, the split is pretty simple. Use DESNZ/DEFRA for UK operational reporting, ADEME's Base Empreinte for French regulatory assessments (BEGES), EPA for US-based operations, and IEA for electricity grid factors across 150+ countries when local national data isn't available [4][5].
Then match the factor set to the data in hand. Use ecoinvent for process-level detail and EXIOBASE when spend data is all you have. Start with supplier-specific data where you can. If that's not on the table, move to process factors, then national averages, and then spend-based proxies for screening [6].
One last point matters more than it might seem: record the database version, system model, and GWP basis for every factor used. That simple paper trail is what makes the result defensible in committee and disclosure [4][7].